
This is a repost/update of a blog post originally published in 2017, by Veronica Woodruff. It’s been updated to incorporate new data since 2017, and we’re sharing it today, given the atmospheric river that is forecast for tomorrow.
by Veronica Woodruff
Like all good Canadians I love the weather. Almost to the point of obsession, especially when I think about it in the context of the hydrology of the Lillooet River. It is so interesting around here with the variability in the seasons and across different elevations.
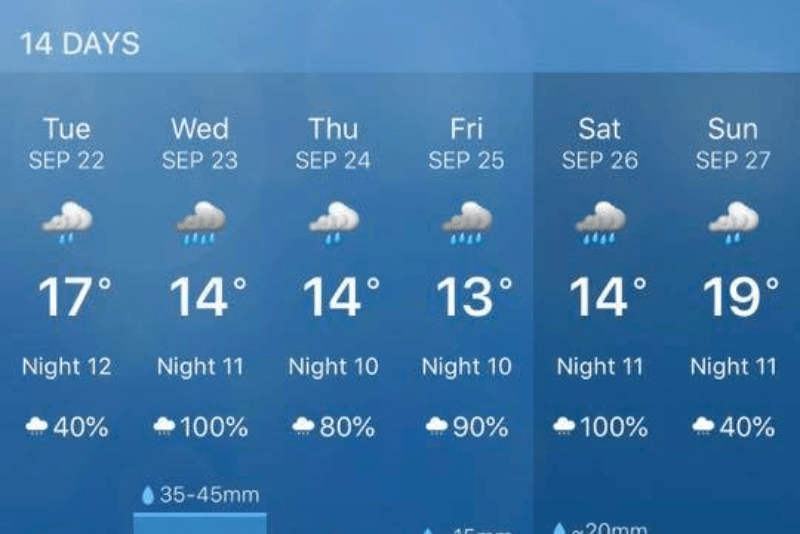
The first of the fall storms are forecasted which makes me reflect on the dynamic system that affects us all.
The nature of a river like the Lillooet is to meander across a valley over time, which doesn’t create the best human settlement conditions.

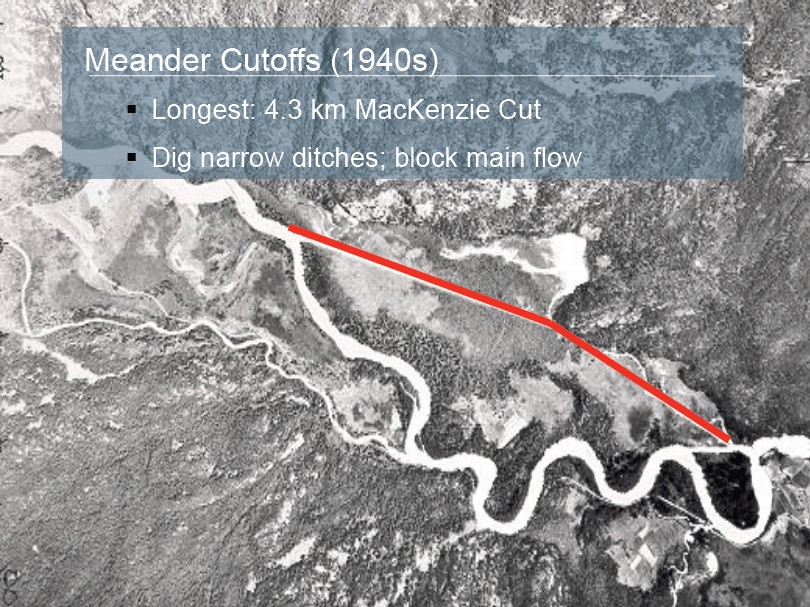
In order to create better settlement conditions, significant flood protection investments were made in the 1940’s and 50’s including dyke construction, river straightening and dredging approximately 473,000 m3 out of Tenas and Lillooet Lake Narrows to lower lake levels (KWL, 2002). Here are a couple of slides to help visualize the works completed (used with permission of Kerr Wood Leidel (KWL)).
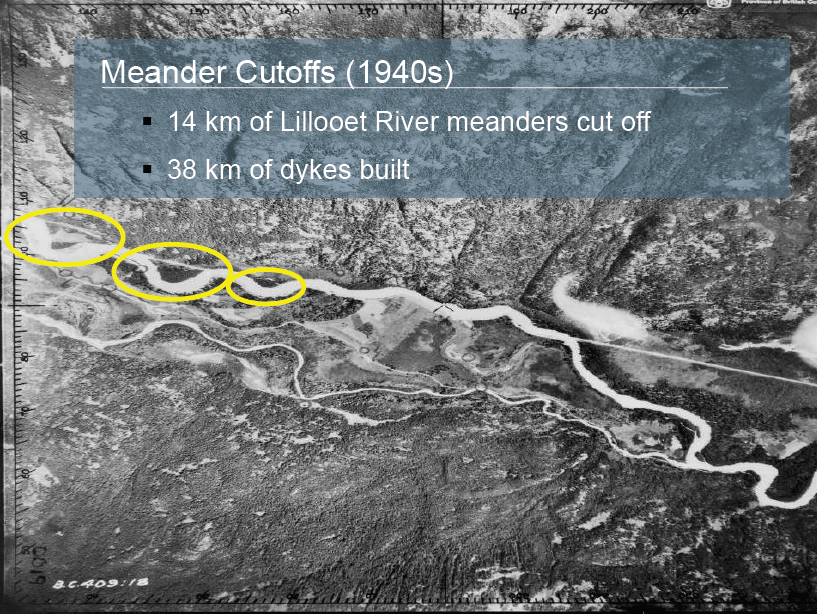
It is particularly cool to see an overlay of the current town center on the 1947 aerial photograph. This shows that most of town was built on a side channel of the Lillooet River.

Since the initial investment, the Pemberton Valley Dyking District (PVDD) continues to work to try and beat the formidable force that is Mother Nature and keep all our feet dry. Strategies include dyke upgrades, flap gates, pump stations and dredging. As you can imagine, every time there is heavy rainfall, sediment (gravel and sand) is transported down the river. This sediment originates from the upper reaches of the Lillooet River valley where the riverbed is steeper, and as the slope of river flattens, the sediment begins to settle along the river bottom. The deposition zone includes the populated areas of the valley, downstream to Lillooet Lake.
The amount of sediment being deposited has increased drastically since the Capricorn Creek landslide that occurred in 2010 on Mt. Meager. This was the largest landslide ever recorded in Canada and the largest in the world since 1947!

All of this sand and gravel has slowly been making its way down the river into the populated reaches through Pemberton and Mount Currie, aided by snowmelt and rainstorms. Original estimates of deposition occurring in the populated areas was concluded to be approximately 30,000 to 40,000m3 (KWL, 2011). Imagine 3000-4000 dump trucks unloading into the river at the train bridge!
The floodplain mapping for the region was updated in 2018 and new estimates has put the annual deposition at four times higher the original estimate, more likely around 180,000m3 (NHC, 2018). All this extra sand in the bottom of the river means that there is less capacity to hold flood water during periods of heavy rainfall.
The PVDD undertakes gravel removal at select locations to ensure the dykes retain capacity and they have doubled their efforts by increasing the volume of removals in the past few years. It’s either that or continue to raise the dykes which can be much more expensive and logistically challenging.
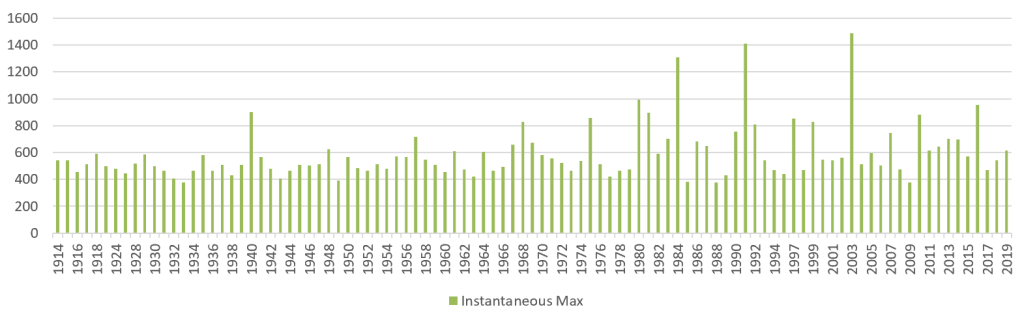
The Government of Canada has maintained a hydrology gauge on the Lillooet River since 1914 (Table 1).
All but two of the top 20 highest flows were caused by rain on snow events in the fall.
Early snowfall (<1m depth) in the alpine does not create a base that can absorb rainfall, but instead will melt and exacerbate the runoff into the rivers. This type of storm with warm, heavy rainfall is something associated with climate change which we should expect to see more often (MOE, 2016).
We can see this trend visually looking at the Lillooet River Gauge record of data where higher returns are more common now. The fact that we haven’t seen widespread flooding is a testament to the extensive work the PVDD has been doing, but all of these big flows are hard on the infrastructure. And if you live on the south side of Highway 99 towards the Business Park, you know that there is more work to be done after the floods in 2016 and 2017.
We once again have an atmospheric river forecasted, with high freezing levels and high amounts of precipitation.
This one is happening as a single event, rather than back to back days of 100mm forecast, like we saw in 2003, and there is no snow in the mountains. It is also forecast to occur while Lillooet Lake and River levels are low. This is ideal because it gives the water a place to go.
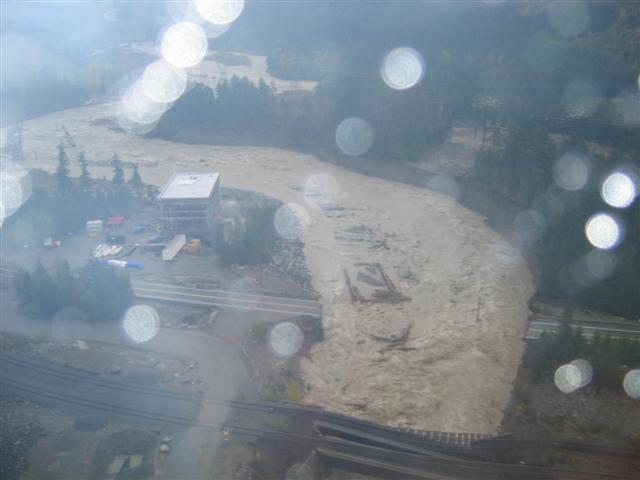
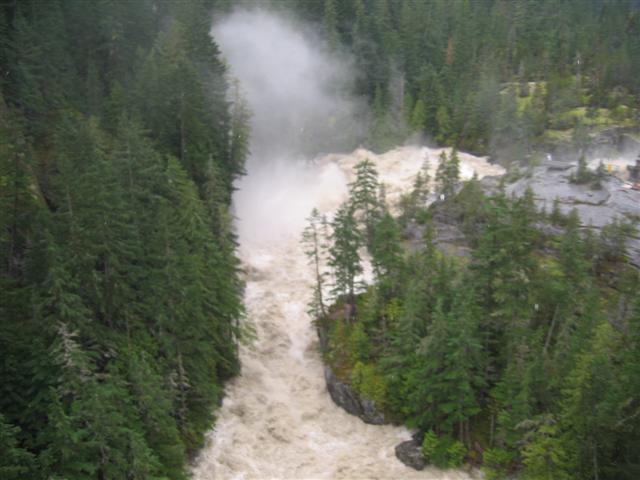
We get widespread issues when the lake is full, the river is at capacity, there is new snow on the mountains, freezing levels are high and the rain is still coming, similar to the 2003 flood (see photos below.)
The 2003 flood was the largest on record and according to previous models, was considered around a 1:200 year event.


However, the updated flood plain mapping, which accounts for additional sediment deposition and climate change effects, that high flow (~1500m3/s) has been reclassified as a 1:50 year event (NHC, 2018).
If you live in the Lillooet River Valley, including Pemberton and Mount Currie, and want to see what this means for your home, the NHC report has excellent maps in the appendices showing anticipated water levels during the 1:50, 1:100 and 1:200 year returns (if you’re a dork like me you will read the whole thing, but the good maps start on page 198).
They also produced these animations showing the progression of water inundation during a flood so you can find your house and see what may happen in a flood scenario:
Always at this time of year, as the snow starts to creep down the mountain side and the mushrooms are happily sporing, I keep one eye on the forecast and one on the river levels.
